4. Check data in iOS app – Swift Charts implementation
This article is based on the session presented at iOSDC2023, Growing apples with Swift This is an article that summarizes the contents of Part 4 of the presentation.
This is a sequel to the article “3. Automatic Water Supply – Operate Raspberry Pi’s GPIO with Swift”. If you haven’t read it yet, please read it!
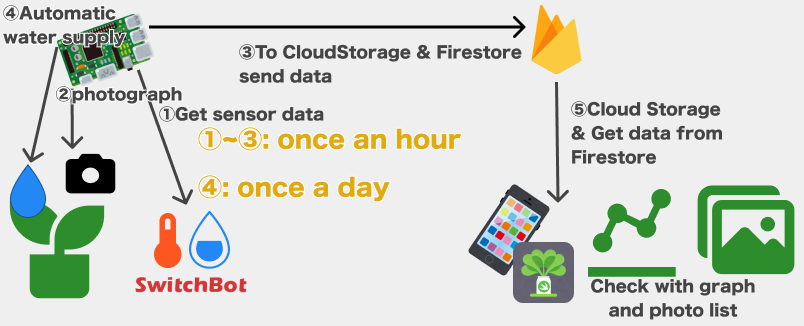
This time, we will summarize the implementation contents of the application side of ⑤!
Allow your app to see Firebase data
This time, I implemented the following in the app
Hourly display of room temperature and humidity for a day (using Charts)
Display hourly photos of the day in a carousel UI (details in repository)
Display photos from a specified period in a time-lapse style
I will summarize the implementation details in order
Graph display implementation
The chart implementation uses Charts available in iOS16~ (I have never touched it, so just It was a good opportunity!)
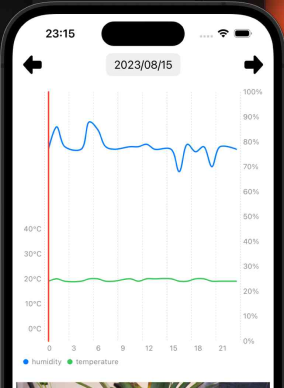
This is the graph I am trying to implement
x-axis
Show time every 3 hours
Y axis
The left side is the temperature (maximum value is 50 (°C))
Humidity on the right (maximum value is 100(%))
Display red vertical line at currently selected time
A line that indicates what hour of the hour photos are displayed below this graph
This line can be moved by tapping in the graph or dragging left and right
Now let’s implement First, prepare a struct for the data model that you need to display This time we will display the temperature and humidity, but the struct itself is common and there is no problem, and we set one property of the enum that allows us to distinguish between them.
enum DataType: String {
    case humidity
    case temperature
}

struct DataModel: Identifiable {
    var id: String { type.rawValue + xValue.description + yValue.description }
    let type: DataType
    let xValue: Date
    let yValue: Int
}
Then convert the array of Models holding the data from Firestore to an array of DataModels above Define humidity and temperature arrays in a common array in an array of DataModel called dataList
let postModels: [FirestoreDataModel] // document of Firestore data

private var dataList: [DataModel] {
    postModels // for humidity
        .map({ DataModel(type: .humidity, xValue: $0.date, yValue: $0.humidity) })
    + postModels // for temperature
        .map({ DataModel(type: .temperature, xValue: $0.date, yValue: Int($0.temperature)) })
}
And implement the Line chart Chart View dataList array prepared earlier Then you can get one of its elements in the closure, so you can set to x/y values of LineMark x is time, y is humidity or pass the temperature value
Last but not least is the setting to display humidity and temperature as separate charts instead of one chart
Now you can see the graph itself! The rest is adjusting the layout of the graph’s X-axis and Y-axis, and implementing gestures
First, set the Y-axis You can customize the Y-axis using .chartYAxis modifiers as shown below AxisMarks to set the position and value of the Y axis to be displayed, and in the closure in such a format, in this case after the value is specified to be displayed with % attached
Chart(dataList) { data in
// ・・・
}
.chartYAxis {
    let humidityValues = [0, 10, 20, 30, 40, 50, 60, 70, 80, 90, 100]
    AxisMarks(
        position: .trailing, // Y-axis display position (left or right)
        values: humidityValues
    ) {
        AxisValueLabel("(humidityValues[$0.index])%", centered: false) // Y-axis value display format
    }
    // ---Set the temperature as above---
}
Next is the implementation of the red line parallel to the Y axis To draw a vertical line, write RuleMark in the Chart In this case, if there is selectedDate, which is the date being selected, a line will be displayed at that time The foregroundStyle specifies the line color
@Binding var selectedHourIndex: Int
let postModels: [FirestoreDataModel]
private var selectedDate: Date? {
    if postModels.isEmpty { return nil }
    return postModels[min(selectedHourIndex, postModels.count - 1)].date
}

Chart(dataList) { data in
    // ----Line chart code above----
    if let selectedDate { // If there is a date in the current selection
        RuleMark(x: .value("Selected date", selectedDate, unit: .hour)) // display vertical line
            .foregroundStyle(Color.red) // change color to red
    }
}
Finally, the implementation of gestures First, implement a common function that determines which X-axis position to move to from the location of the tap or drag gesture GeometryReader or ChartProxy xPosition calculates the location in the graph relative to the top left of the graph by subtracting the location of the top left of the graph from the location of the entire view. You can and use proxy.value(atX: ) to return the x value of the graph from the location X value and I wanted to animate the movement of the red vertical line when changing selectedHourIndex, so I updated it in withAnimation
func updateSelectedDate(at location: CGPoint,
                                          proxy: ChartProxy, geometry: GeometryProxy) {
    let xPosition = location.x - geometry[proxy.plotAreaFrame].origin.x // tap coordinate - upper left coordinate of graph
    guard let date: Date = proxy.value(atX: xPosition) else { return } // Find x value from tap coordinates
    withAnimation {
        selectedHourIndex = postModels
            .map(.date)
            .firstIndex(where: { $0.hour == date.hour }) ?? 0
    }
}
and implement the gesture that calls the above method chartOverlay allows you to add an overlay view to your chart. We use this to place a transparent view, implement tap and drag gestures on that view, and call the updateSelectedDate we just implemented in it.
.chartOverlay { proxy in
    GeometryReader { geometry in
        Rectangle().fill(.clear).contentShape(Rectangle())
            .gesture(DragGesture()
                .onChanged { value in
                    updateSelectedDate(at: value.location,
                    proxy: proxy,
                    geometry: geometry)
                 })
            .onTapGesture { location in
                updateSelectedDate(at: location,
                    proxy: proxy,
                    geometry: geometry)
            }
    }
Implementation to display hourly photos of the day in a carousel UI
Next, we will implement a UI that can display up to 24 photos in a carousel format, every hour of the day. Since the token is not attached, use the Firebase SDK just before downloading the image, pass the file name, and issue the URL with the token
static func getImageURL(pathName: String) async throws -> URL {
    let storage = Storage.storage()
    let storageRef = storage.reference()
    let starsRef = storageRef.child(pathName)
    return try await starsRef.downloadURL()
}
Next is the implementation of the image display component Use SDWebImageSwiftUI to call the above URL issuing method and also use cache etc.
struct AsyncImageView: View {
    @State var url: URL?
    @State var error: Error?
    let imageName: String

    var body: some View {
        Group {
            if error != nil {
                Image(systemName: "photo")
            } else {
                WebImage(url: url)
                    .resizable()
                    .placeholder(content: {
                        ProgressView()
                            .font(.largeTitle)
                    })
                    .indicator(.progress)
                    .scaledToFit()
                    .transition(.fade(duration: 0.5))
            }
        }
        .task {
            do {
                url = try await FirebaseManager.getImageURL(pathName: imageName)
            } catch {
                print(error)
                self.error = error
            }
        }
    }
}
Finally, use this AsyncImageView to implement the image list UI This time, use TabView’s PageTabViewStyle to implement
struct ImageCarouselView: View {
    @Binding var selectedIndex: Int
    let imageNameList: [String]

    var body: some View {
        TabView(selection: $selectedIndex.animation(.spring())) {
            ForEach(imageNameList.indexed(), id: .element) { (index, name) in
                AsyncImageView(imageName: name)
                    .tag(index) // to get selected index
            }
        }
        .tabViewStyle(PageTabViewStyle(indexDisplayMode: .always))
    }
}
When displayed together with the previous graph, it will be displayed as follows
Although the implementation is not that complicated, the page of the carousel changes in real time when the graph is dragged with a gesture, so here it is like an incremental search, when the gesture is completed or after the value is changed. There seems to be room for refactoring such as switching pages after passing
Implementation to display photos of a specified period in a time-lapse style
Finally, it is an implementation that displays the photos of the day in a time-lapse style I think there are various ways to implement this specification, but this time I will use animationImages of UIImageView Wrap the View implemented here with UIViewRepresentable and display it
let imageView = UIImageView()
imageView.contentMode = .scaleAspectFit
imageView.animationImages = images
imageView.clipsToBounds = true
// Display an image every 0.3 seconds
imageView.animationDuration = TimeInterval(floatLiteral: Double(images.count) * 0.3)
if !images.isEmpty {
    imageView.startAnimating()
}
Also, since an array of UIImages is required for use, it is collected from CloudStorage before display This implementation uses the SwiftConcurrency Group mechanism. Issue URL for download with this and download it in parallel
private func fetchList() async throws {
    Task {
        do {
            let results: [FirestoreDataModel]
            if ProcessInfo.processInfo.environment["XCODE_RUNNING_FOR_PREVIEWS"] == "1" {
                results = FirestoreDataModel.mocks
            } else {
                results = try await FirebaseManager.fetchList(fromDate: date., endDate: date.offsetDays(offset: 1) ?? Date())
            }
            let imageList = try await withThrowingTaskGroup(of: UIImage?.self) { group in
                results.map(.imageName).forEach { imageName in
                    group.addTask {
                        return try await FirebaseManager.getImageURL(pathName: imageName).asUIImage()
                    }
                }
                var images: [UIImage] = []
                for try await image in group {
                    guard let image else { break }
                    images.append(image)
                }
                return images
            }
            let images = imageList.compactMap { $0 }
            self.images = images
        } catch {
            print(error)
        }
    }
}
Now you can display up to 24 photos of the day in carousel format! However, since the image size is large now, it takes a long time to download, so I would like to add resizing processing when saving on the Raspberry Pi side
Wrap up
In this article, we summarized the contents of the four parts of the SwiftGarden presentation, including the implementation of graphs. The next article is a summary article!